Uncertainty in LIDT Specifications
This is Section 14.9 of the Laser Optics Resource Guide.
Laser-induced damage threshold (LIDT) specifications are not an absolute guarantee that damage will not occur below a certain value. Uncertainty in the LIDT value is introduced due to fluctuations in the test laser, the damage detection method, and under sampling the defects on the optic. This uncertainty leads to a confidence interval around the true damage probability as a function of fluence.
What is obtained from LIDT testing is a probability function based on a binomial distribution of experimental data. The confidence interval of damage occurring in a real setting can be determined using a Wilson score interval dependent on the probability function, and the number of observations made. The Wilson score interval (w) is a binomial proportion confidence interval given by:
n is the number of shots at each fluence level, P is the experimentally determined probability of damage, and z is the probit, or the quantile function of the standard normal distribution.1 z corresponds to the desired confidence level. For example, z=1.96 for a 95% confidence level.
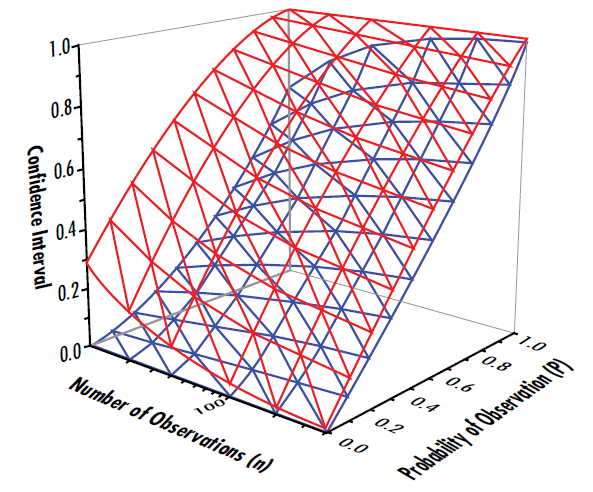
The ± sign in Equation 1 results in two possible values for the Wilson score interval. The higher value is the upper range of the confidence interval for whether or not damage will occur in a real application, while the lower value is the lower limit of the confidence interval of damage. Plotting w as a function of both n and P creates a 3D plot that represents a visual for determining the probability range of damage at a given confidence level (Figure 1). In Figure 1, at 10 shots per fluence level, it is only possible to know the probability of damage to approximately ±25%. If zero damage events are viewed over ten test sites, the worst-case probability of approximately 25% that damage would occur at the 11th site. In order to know the probability of damage of better than ±5%, more than 100 shots are required at every fluence level. This high number of shots per fluence level is usually cost prohibitive, making simulation the ideal option for predicting the true behavior of an optic.

Figure 1: Confidence interval of the probability of damage of an optic, where the red surface is the upper limit of the confidence interval of whether damage will occur and the blue surface is the lower limit of the confidence interval
References
- Wilson, Edwin B. “Probable Inference, the Law of Succession, and Statistical Inference.” Journal of the American Statistical Association, vol. 22, no. 158, 1927, pp. 209–212., doi:10.2307/2276774.
More Resources
- Understanding and Specifying LIDT of Laser Components Application Note
- Laser Damage Threshold Testing Application Note
- Laser Damage Threshold Scaling Calculator
- Different Types of LIDT Specifications Application Note
- Bulk Laser Damage in Glass Application Note
- Importance of Beam Diameter on Laser Damage Threshold Application Note
- LIDT for Ultrafast Lasers Application Note
- Why Laser Damage Testing is Critical for UV Laser Applications Application Note
- A Guide to (Not Over) Specifying Losses in Laser Optics Application Note
- Metrology at Edmund Optics: Measuring as a Key Component of Manufacturing Video
- Metrology for Laser Optics Application Note
- Key Parameters of a Laser System Application Note
- Laser Optics Lab Video Series


 Previous Section


or view regional numbers
QUOTE TOOL
enter stock numbers to begin
Copyright 2023, Edmund Optics India Private Limited, #267, Greystone Building, Second Floor, 6th Cross Rd, Binnamangala, Stage 1, Indiranagar, Bengaluru, Karnataka, India 560038
California Consumer Privacy Acts (CCPA): Do Not Sell or Share My Personal Information
California Transparency in Supply Chains Act